Spectral Clustering
cluster.cluster provides an interface for k-Means Clustering and Spectral Clustering.
-
class
SpectralClustering(k: int, max_iter: int = 1000, rep: int = 10, seed: Optional[int] = None, eps: float = 1e-10, norm: Optional[int] = None, sparse: bool = True, graph: str = 'kNN', graph_param: Union[int, float] = 5, normalized: bool = True, vectorize_similarity_matrix: bool = True)¶ Spectral Clustering object
- Parameters
k – the number of clusters to create
max_iter – maximum number of iterations to perform for convergence of clusters in k-Means iteration
rep – number of times to repeat the k-Means clustering algorithm
seed – seed to use
eps – stopping criterion
norm – the norm to use
sparse – whether to use a sparse representation of the graph (using scipy.sparse)
graph – one of ‘kNN’, ‘mkNN’, ‘eps’, ‘fc’ - ‘kNN’: k-Nearest-Neighbor graph - ‘mkNN’: mutual k-Nearest-Neighbor graph - ‘eps’: epsilon connected graph - ‘fc’: fully connected graph
graph_param – the parameters for the specified graph (i.e.: number of neighbors, epsilon)
normalized – whether to use normalized spectral clustering
vectorize_similarity_matrix – whether to vectorize the matrix or filling the matrix iteratively
-
cluster(points: numpy.array) → numpy.array¶ cluster the points provided
- Parameters
points – the dataset to be clustered in form (N x d) where N is the number of points to be clustered
- Returns
None
-
get_L() → numpy.array¶ get graph Laplacian L
- Returns
graph Laplacian L
- Return type
np.array
-
get_S() → numpy.array¶ get similarity matrix S
- Returns
similarity matrix S
- Return type
np.array
-
get_labels() → numpy.array¶ get labels
- Returns
labels
- Return type
np.array
-
get_points() → numpy.array¶ get clustered points
- Returns
points
- Return type
np.array
Example
import numpy as np
from scipy.stats import multivariate_normal
from cluster.cluster import SpectralClustering
from cluster.utils import visualize_clusters_2d, visualize_graph_2d
# matplotlib only for visualization
import matplotlib.pyplot as plt
# create the dataset
np.random.seed(42)
N1 = 25
N2 = 75
r1 = 1 / 4
r2 = 3 / 4
x1 = 2 * np.pi * np.random.rand(N1)
x2 = 2 * np.pi * np.random.rand(N2)
r1 = r1 + np.random.rand(N1) * 0.1
r2 = r2 + np.random.rand(N2) * 0.1
points = np.vstack([np.concatenate([r1 * np.cos(x1), r2 * np.cos(x2)]),
np.concatenate([r1 * np.sin(x1), r2 * np.sin(x2)])]).T
# cluster the dataset
spectral_clustering = SpectralClustering(k=2, graph_param=5)
spectral_clustering.cluster(points=points)
labels = spectral_clustering.get_labels()
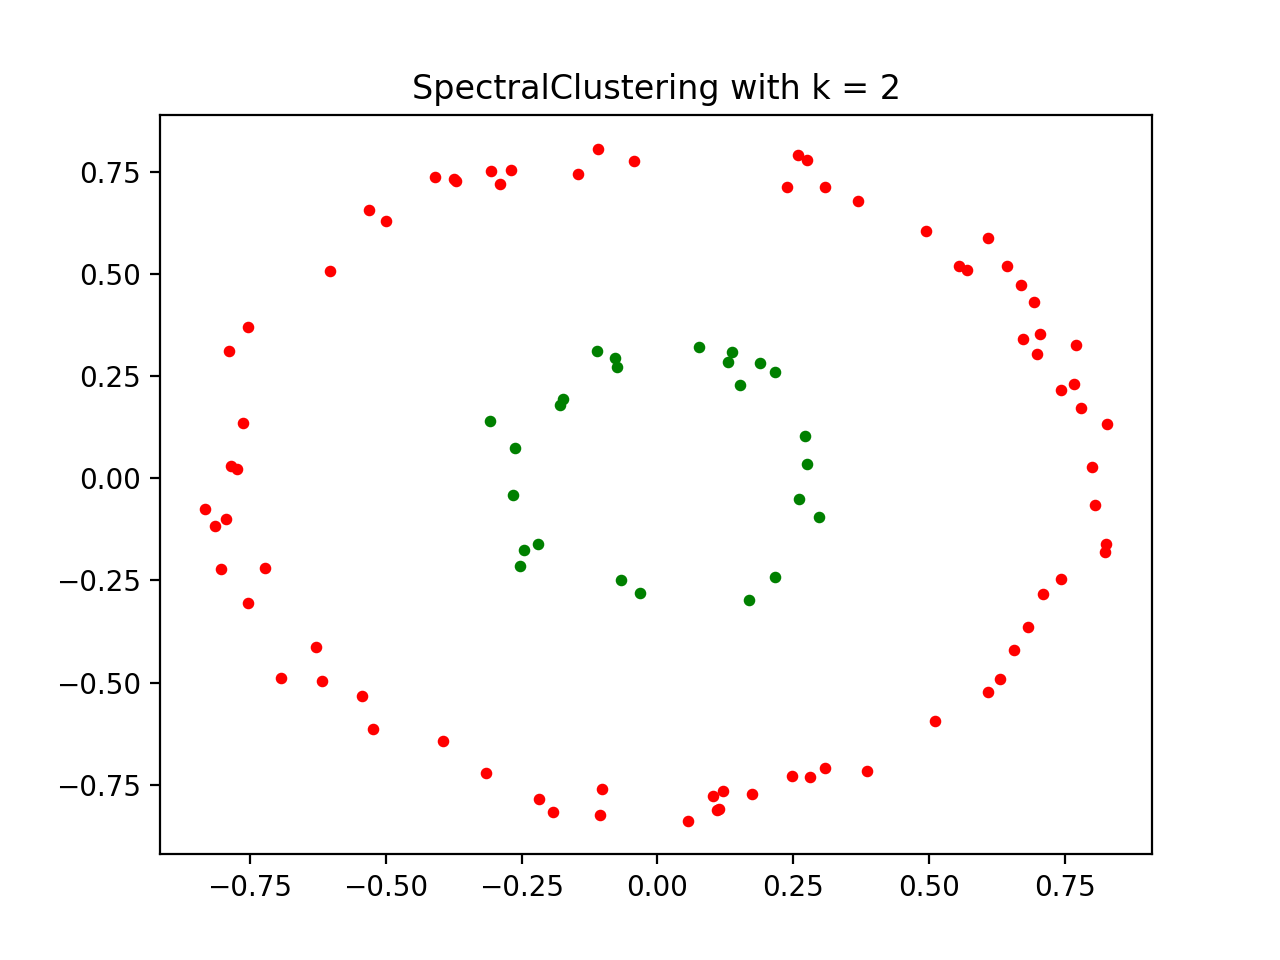
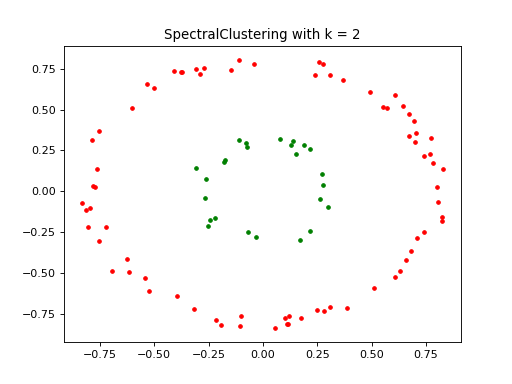
# visualize the dataset in 2D
fig, ax = plt.subplots()
ax = visualize_clusters_2d(points, labels, ax, 'SpectralClustering with k = 2')
plt.show()
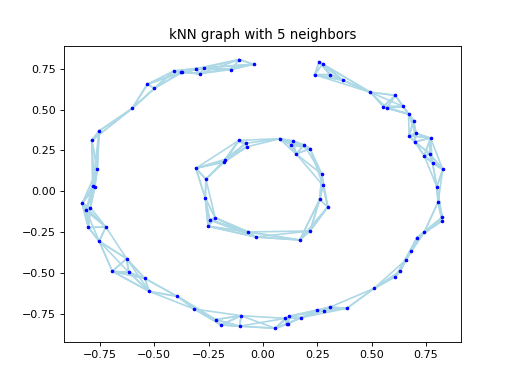
# visualize the graph
fig, ax = plt.subplots()
visualize_graph_2d(points, spectral_clustering.get_graph(), ax, 'kNN graph with 5 neighbors')
plt.show()
(Source code, png, hires.png, pdf)